Traditional snapshot
What is happening now?
- CPU is 62%
- Memory is 71%
- Temperature is elevated
- Useful, but context is left to you
Available on all platforms
Pimon learns what normal looks like on your device, models how its system signals move together, and highlights sustained changes before they become easy to miss.
Not another utilization gauge.
A view of change from your device's own normal.
Load is not stability
Traditional monitors answer “how much is being used?” Pimon asks a different question: “is the way this device is behaving still consistent with its learned pattern?”
Traditional snapshot
Pimon's signal
The science made clear
Pimon uses established time-series and statistical ideas as an engineering instrument, not a crystal ball. It looks for evidence that recent behavior has moved away from a device's own learned normal.
Sample independent system channels such as CPU, memory, storage and network. On supported devices, thermal, battery and GPU signals add context.
Build a device-specific baseline using rolling windows and robust statistics. Normal background rhythms become context rather than automatic alarms.
Estimate how recent signals predict one another with a regularized multivariate time-series model, then measure departures in predictive structure.
Combine magnitude, persistence, reliability and subsystem contribution into plain-language states: Learning, More stable, Less stable or Unstable.
Signal one
Summarizes how far current predictive behavior has moved from the learned baseline. Small within-baseline variation is softened; sustained departures carry more weight.
Signal two
Examines lag-one asymmetry in recent multivariate change after normalizing channel scale. It is a bounded engineering indicator, not literal physical entropy production and not proof of failure.
Want the full methodology? See the estimator, baseline logic, interpretation rules and honest limitations in one readable brief.
The science made clear →Inside Pimon
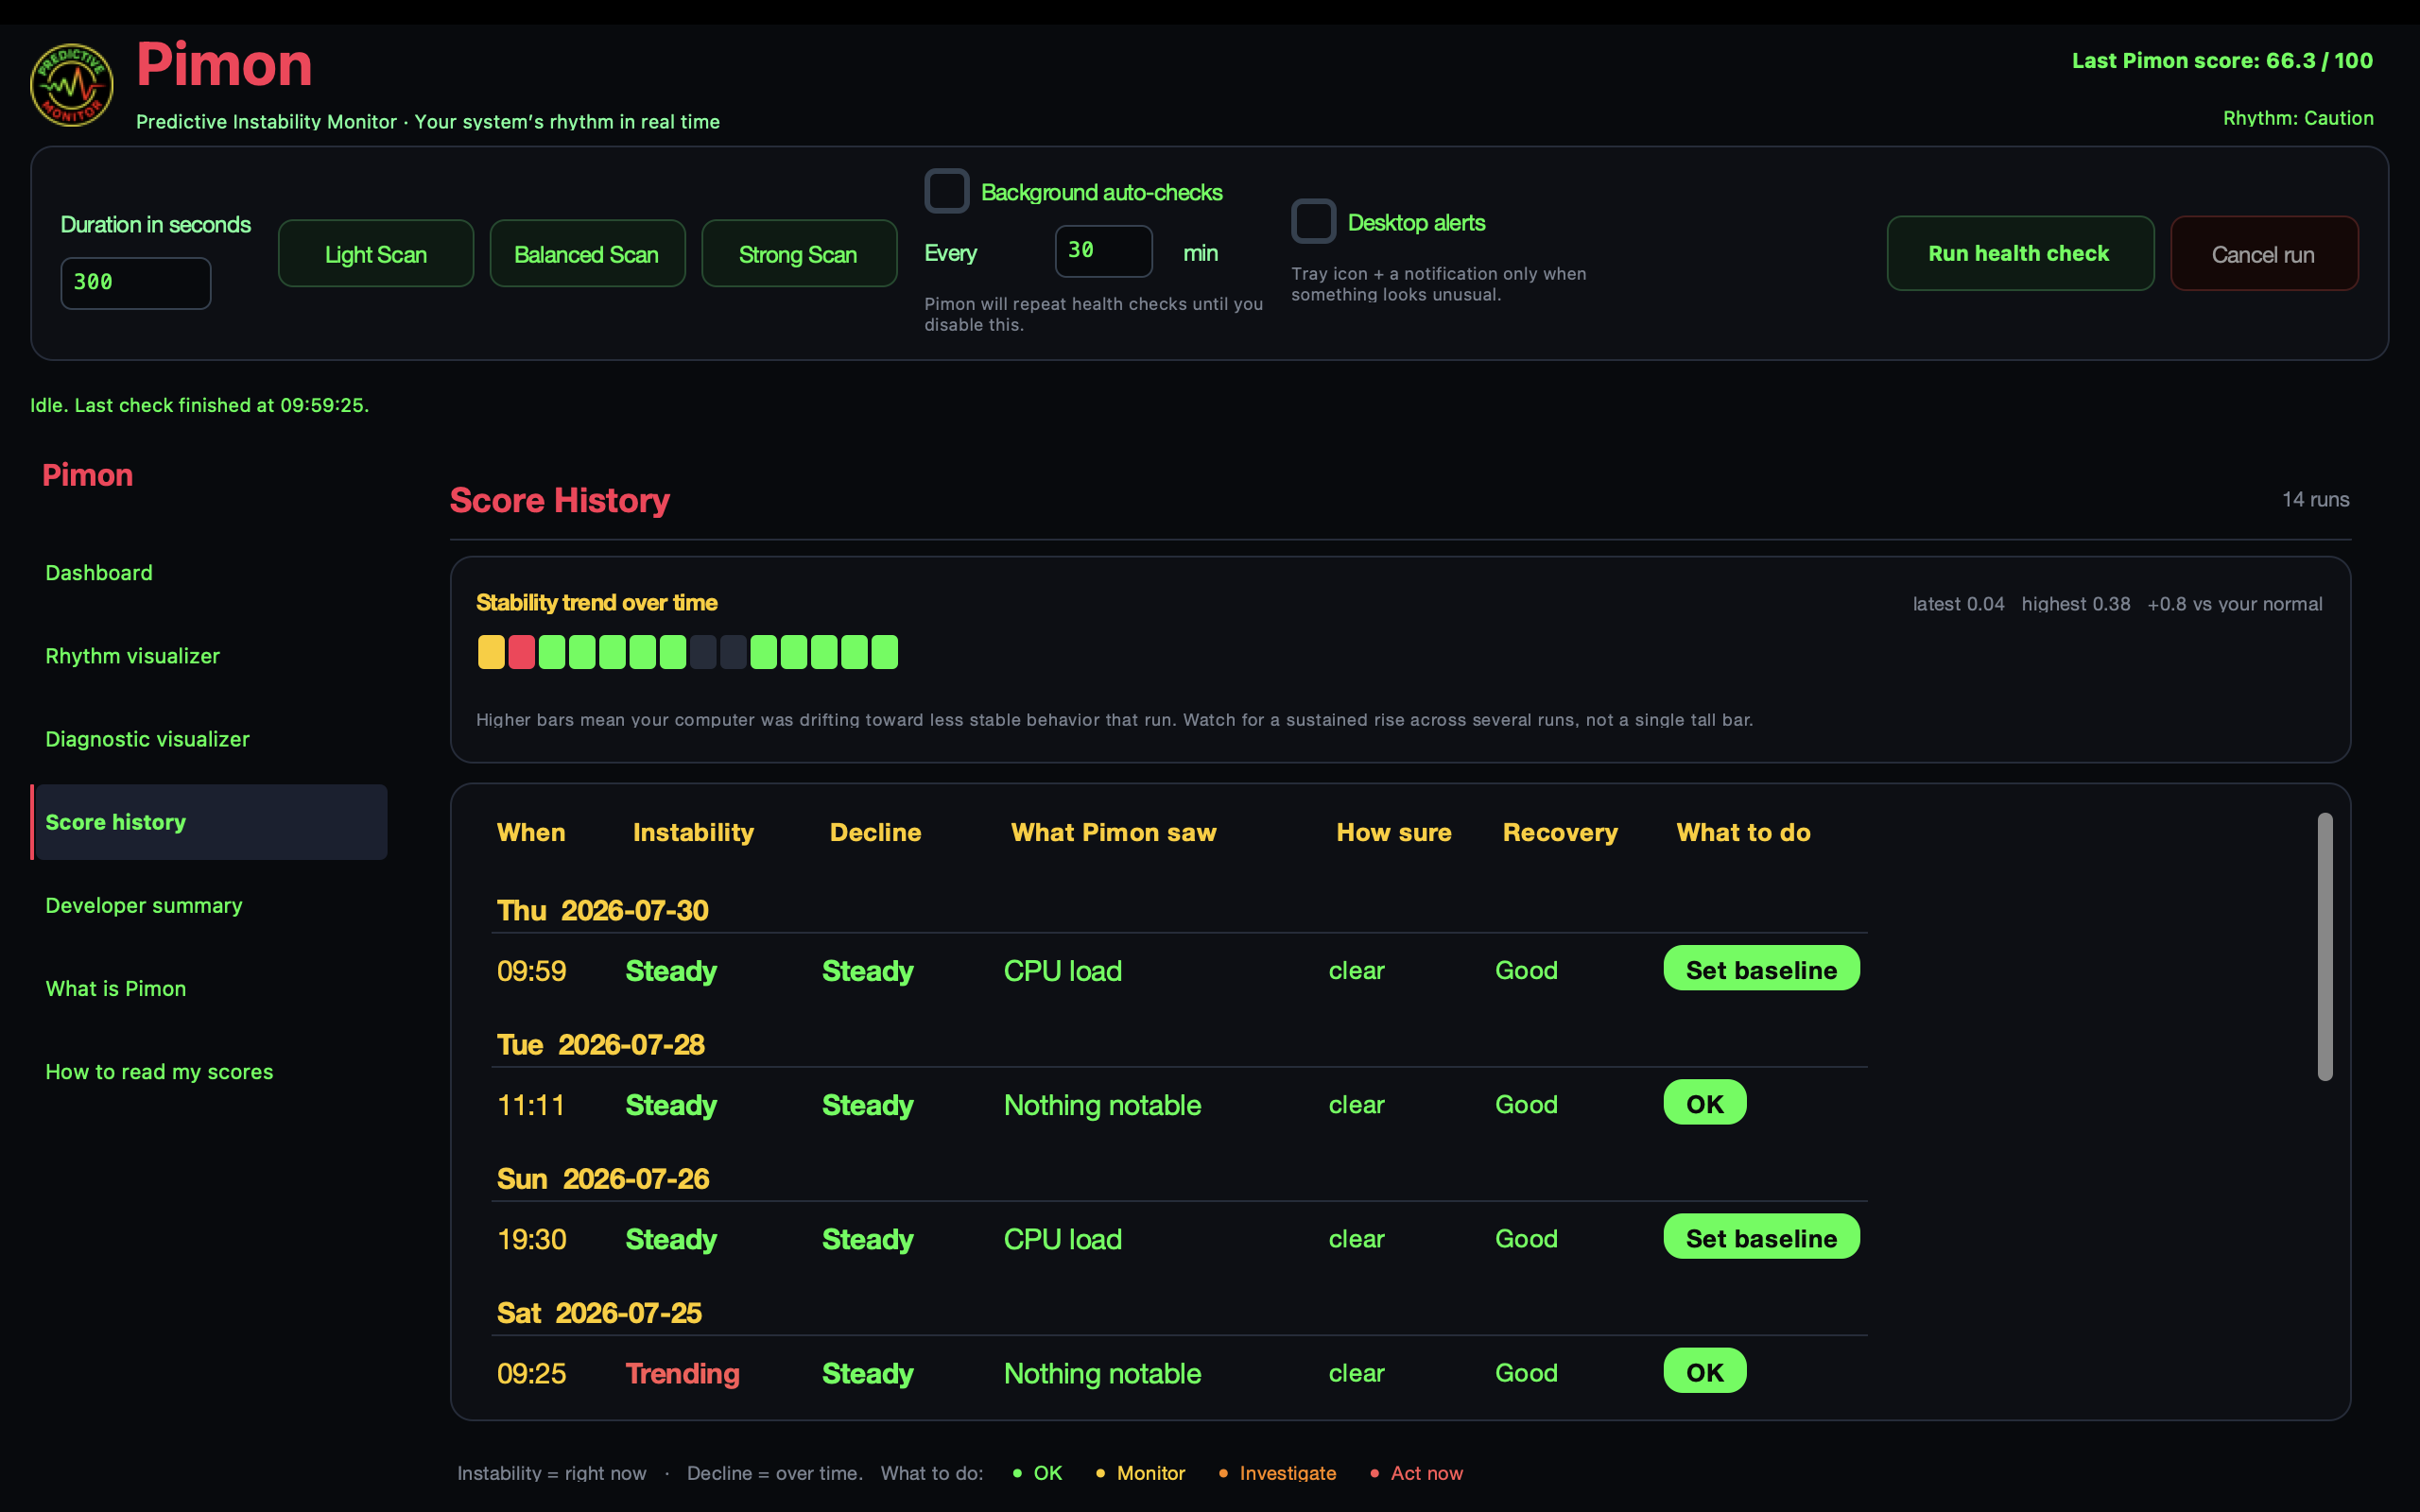
Start with a single summary, then inspect rhythm, contributing systems and history when something changes.
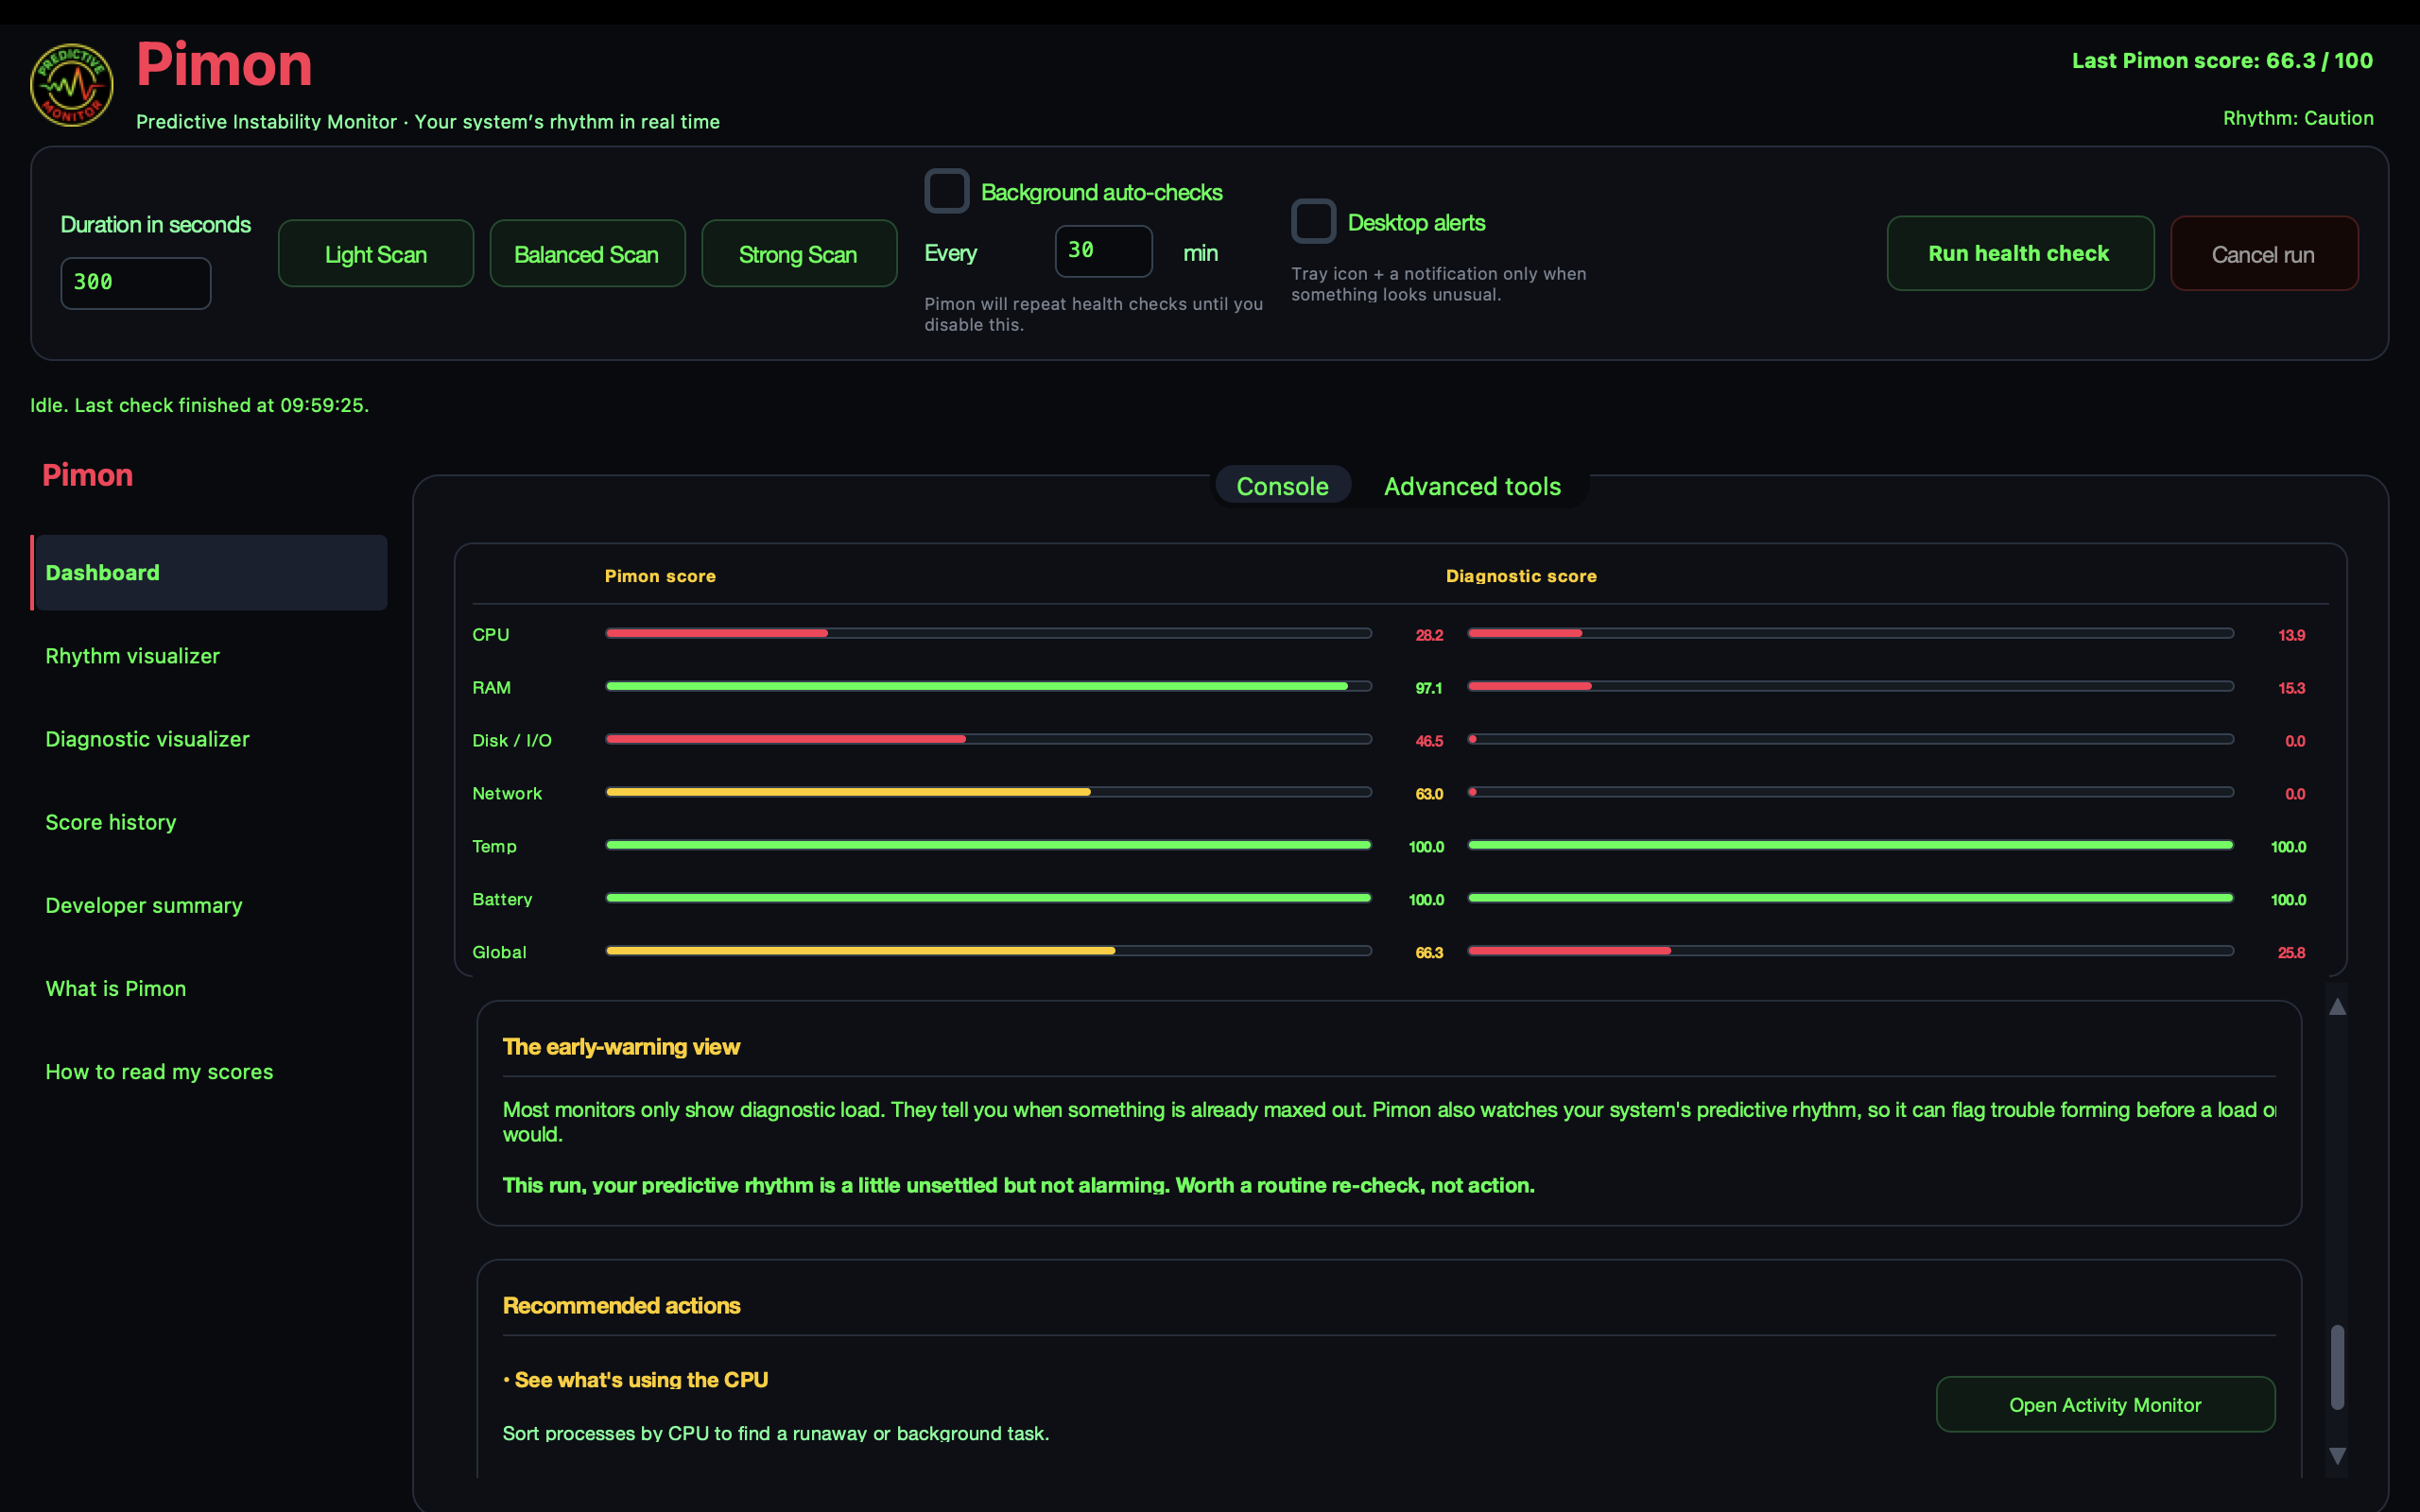
The dashboard turns live measurements into a concise predictive summary, with the most relevant contributing areas close at hand.
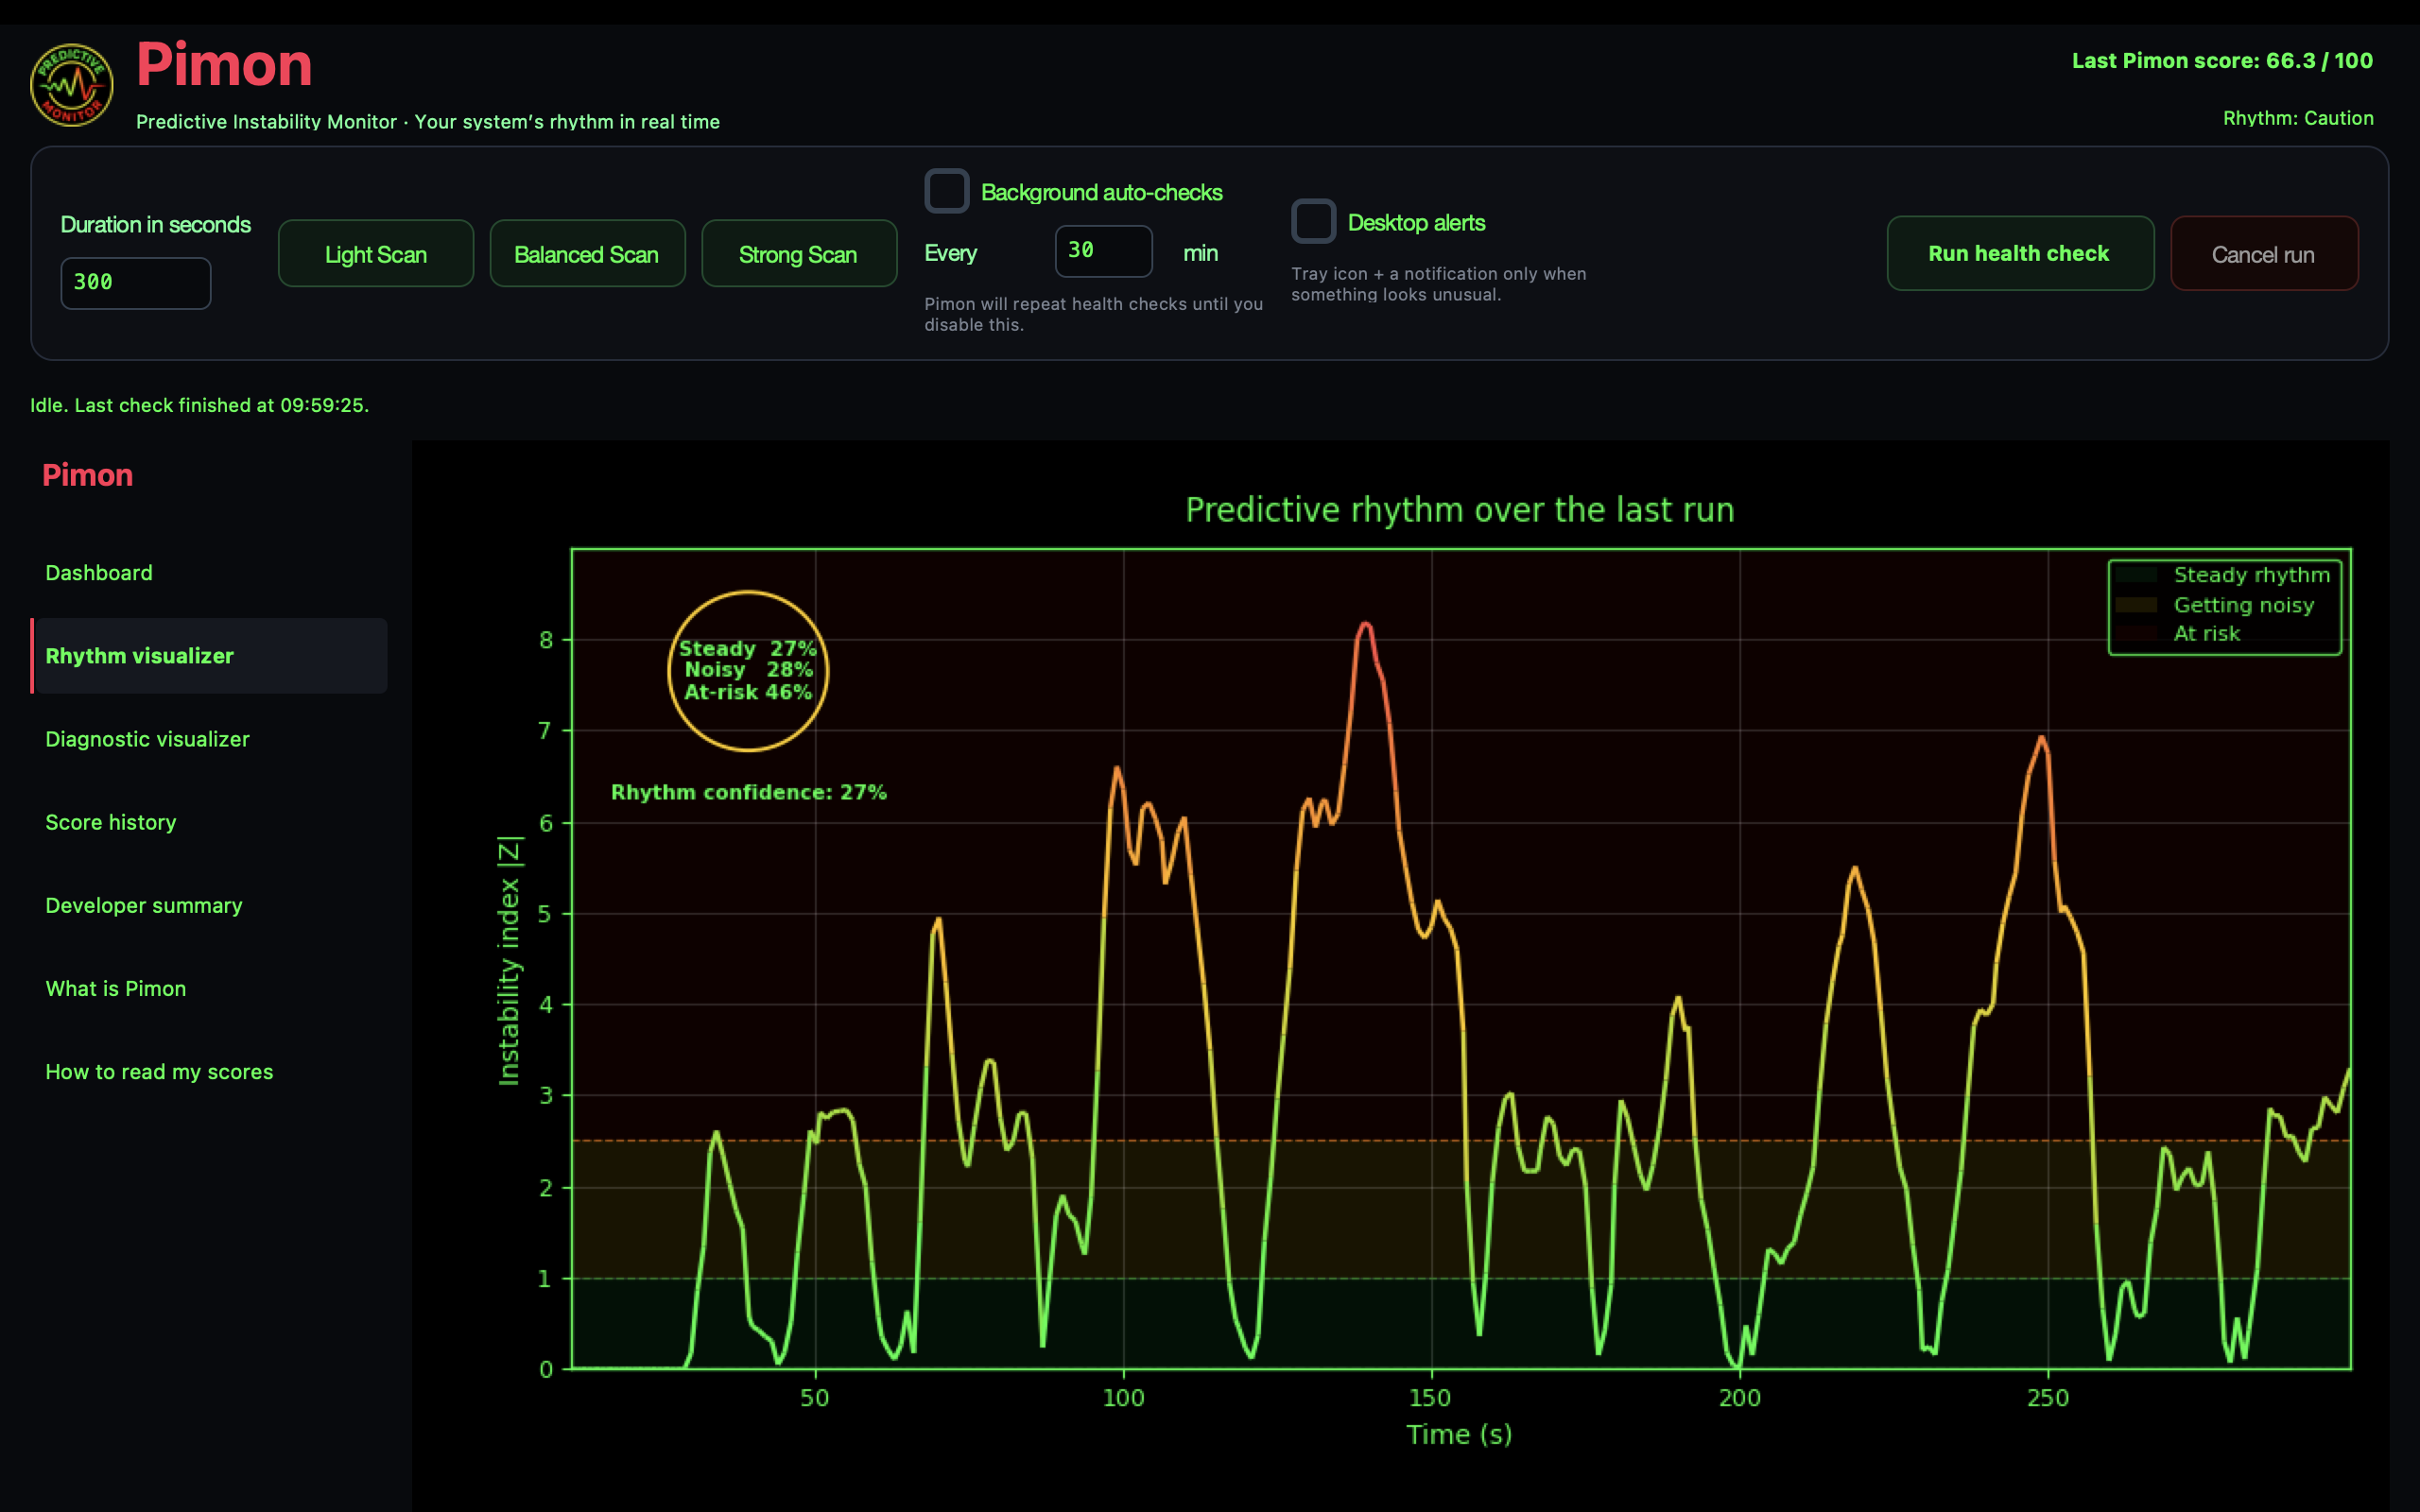
Built for the moments between “fine” and “obvious”
Pimon is most useful as a context tool: observe normal behavior, compare demanding workloads, and see whether the device returns to its baseline.
Let Pimon observe ordinary browsing, work, gaming or idle time so later changes have meaningful context.
See how the device responds during sustained work and whether its predictive pattern remains orderly.
After a heavy task ends, history helps you see whether the device settles or continues to show unusual behavior.
Available now
Choose your platform. Pimon runs locally, requires no account, and keeps its analysis on the device.
Questions, answered
No. Pimon detects unusual and sustained changes in measured behavior. A warning can reflect heavy workload, an update, low storage, thermal pressure, a driver issue or a real problem. It is an early-context tool, not a guarantee or hardware diagnosis.
No. The baseline is learned from your device. That makes the signal personal to its hardware, operating environment and normal rhythms.
No developer account, cloud analytics or remote monitoring service is required. Analysis and history remain local to the device.
Keep using them. They are excellent for current utilization and process detail. Pimon complements them by focusing on how multivariate behavior changes over time relative to a learned baseline.
Pimon begins forming a baseline quickly and improves its context as it observes more normal behavior. A “Learning” state means the app does not yet have enough reliable evidence for a directional interpretation.


